
After at least four consecutive weeks of growth, the three major domestic indexes all lost ground this week. The S&P 500 was down 0.44%, the Dow lost 0.49%, and the NASDAQ declined 0.15%.1 Meanwhile, international stocks in the MSCI EAFE grew by 0.38%.2
This week, the Fed meets to determine whether or not to raise benchmark interest rates for the first time in 2017. Right now, the market gives a 93% chance of a rate hike.3
In this update, rather than analyzing what lies ahead or what happened last week, we would like to acknowledge just how far the U.S. economy has come since 2009.
On March 9, we marked the 8-year anniversary of when markets during the Great Recession hit the bottom on their lowest day. At that point in the economic meltdown, the Dow and S&P 500 had both lost more than 50% of their value since October 2007.4 Every investor likely remembers the fear that gripped the U.S. and global economies, as questions lingered of how low we could go.
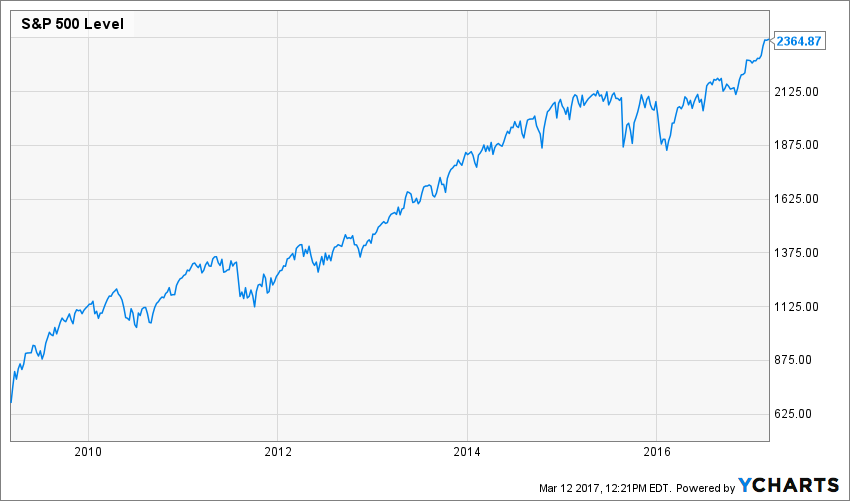
Today, we can see just how far the markets and economy have come since March 200—and the growth investors could have missed if they avoided the markets. Take, for instance, the S&P 500.
On March 9, 2009, the index fell to 676.53.5 Eight years later it rebounded to 2364.87.6 With reinvested dividends, that growth represents an average annual increase of 19.45%.7 And the fundamental data tells a very similar story.
- Gross Domestic Product
- March 2009: We learned the economy had fallen by a 6.3% annual rate during the fourth quarter of 2008—its largest decline in 26 years.8
- Today: GDP recovery has been more plodding than many people might prefer, but nonetheless, nearly every quarter has shown growth since 2009.9 And over the past two years, GDP has increased at a 3.2% annual rate.10
- Home Prices
- March 2009: The median home price was $169,900.11
- Today: The most recent data from January 2017 indicates that median home prices have increased to $228,900—a 34.7% increase since March 2009.12
- Unemployment
- March 2009: The unemployment rate was 8.7% and would climb to 10% by October 2009.13
- Today: The most recent data from February 2017 shows an unemployment rate of 4.7%.14
- Total Employment
- March 2009: The economy had lost millions of jobs during the recession and would continue to lose millions more throughout 2009.15
- Today: As of February 2017, the economy has added nearly 12 million jobs since March 2009.
Throughout this economic recovery, people have seemed concerned the bull market was about to end. When discussing the bottom of the market 5 years ago, in the March 12, 2012 Weekly Update, we wrote about many analysts’ worries that a pullback was imminent. Even last year, one MarketWatch columnist wrote an article titled “Happy Birthday Bull Market—Now Write Your Will,” warning that the markets would not reach new peaks in the near future.17 The S&P 500 has gained around 19% in the months since then.18
Of course, no one can predict exactly when this bull market will begin to decline. And at 8 years old, only one recovery has lasted longer since World War II.19
As always, we will continue to offer the advice we believe suits your best interests in every market environment: Focus on your long-term goals and personal needs, not headlines and emotions. We have come a long way in 8 years, and we will continue to guide you through the market's changing times and inevitable fluctuations. If you have questions about where you stand today or how to prepare for tomorrow, we are here to talk.
News 12 interviewed me about my latest book, Life on your terms:
I was on PIX, last week, sharing tips on last minute tax deductions:
Sources

INVESTING RISK DISCLOSURE
Keep in mind that investing involves risk. The value of your investment will fluctuate over time and you may gain or lose money. Before investing, consider the funds’ investment objectives, risks, charges, and expenses. Contact Mahoney Asset Management for a prospectus or, if available, a summary prospectus containing this information. Read it carefully.
IMPORTANT CONSUMER INFORMATION
This web site has been prepared solely for informational purposes. It is not an offer to buy or sell any security; nor is it a solicitation of an offer to buy or sell any security.This site and the opinions and information therein are based on sources which we believe to be dependable, but we can not guarantee the accuracy of such information.
Representatives of a broker-dealer or investment adviser may only conduct business in a state if the representatives and the broker-dealer or investment adviser they represent: (a) satisfy the qualification requirements of, and are approved to do business by, the state; or (b) are excluded or exempted from the state’s licenser requirements.
An investor may obtain information concerning a broker-dealer, an investment advisor, or a representative of a broker-dealer or an investment advisor, including their licenser status and disciplinary history, by contacting the investor’s state securities law administrator.
The financial calculator results shown represent analysis and estimates based on the assumptions you have provided, but they do not reflect all relevant elements of your personal situation. The actual effects of your financial decisions may vary significantly from these estimates–so these estimates should not be regarded as predictions, advice, or recommendations. Mahoney Asset Managment does not provide legal or tax advice. Be sure to consult with your own tax and legal advisors before taking any action that would have tax consequences.
SECURITIES: ARE NOT FDIC-INSURED/ARE NOT BANK-GUARANTEED/MAY LOSE VALUE
This information is intended for use only by residents of CA, CT, DC, FL,, MA, MD, MN, NC, NJ, NY, OH, PA, and VA. Ken Mahoney may only conduct securities business with residents of the states and/or jurisdiction for which they are properly registered.
Securities offered through Newbridge Securities Corporation, member FINRA, SIPC.
Investment Advisory services through NFSG Corporation an SEC Registered Investment Advisor.
Office of Supervisory Jurisdiction: 1200 N. Federal Hwy., Ste. 400, Boca Raton, FL 33432. Phone 954.334.3450 Fax 954.489.2390
Specific recommendations can only be based on review of a number of suitability factors including but not limited to the investors financial profile, investment objectives, risk tolerance and the investors review of appropriate offering documents. Past performance is no guarantee of future results. To help you make informed decisions, we provide you with essential disclosures, such as Regulation Best Interest (Reg BI), the Client Relationship Summary (CRS), and Form ADV. Linked sites are strictly provided as a courtesy. Newbridge Securities, Inc. does not guarantee, approve nor endorse the information or products available at the sites, nor do links indicate any association with or endorsement of the linked sites by Newbridge Securities.