
Access Premium Content
If you are a client, please enter your name & email address below. You will be redirected to the premium content once you click “Submit.”
WEEK IN REVIEW
Markets were jarred by plummeting oil prices last week, giving the Dow and S&P 500 their worst weeks of 2014.1 For the week, the S&P 500 lost 3.52%, the Dow fell 3.78%, and the Nasdaq dropped 2.66%.2
Markets reacted badly to crude oil’s slide largely because of its economic implications for oil producers like Russia. What’s bad for Russia is bad for its largest trading partner – Europe. Though the U.S. economy is doing well, economic troubles in Europe could be potentially bad for U.S. companies.3
Though it can be depressing to experience a market drop so close to the end of the year, there may be a silver lining to oil’s decline. In this week’s update, we’re taking a look at some of the short- and long-term factors behind the drop in oil prices.
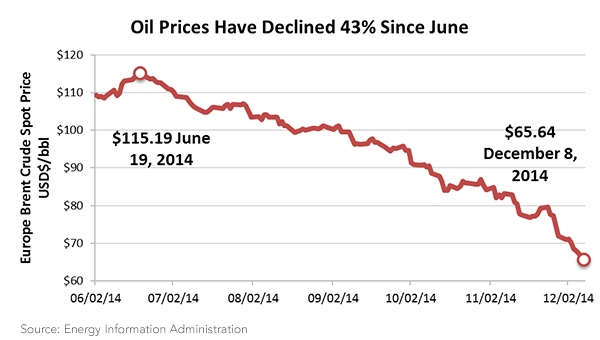
Since June, the price of Brent crude, one of the most commonly used crude oils, has fallen from a high of $115.19 to the current low of $65.64.4
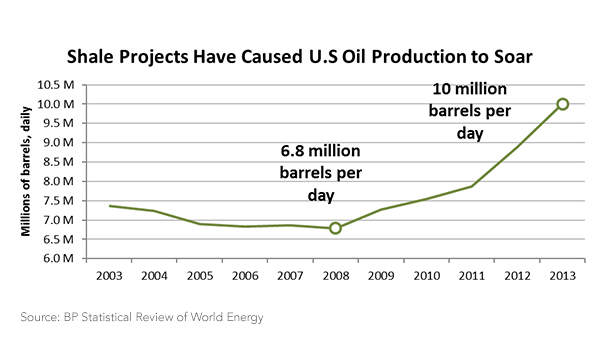
In the short term, the rise of the United States as an oil-producing power has pushed up global oil supplies, thus depressing oil prices.
In November, the Organization of the Petroleum Exporting Countries (OPEC), an international group that coordinates oil production between members to stabilize prices, met to determine production quotas. While the group, whose members control 40% of global oil supplies, could have acted to reduce the oil glut by cutting production, they voted to maintain current production levels, sending oil prices even lower.5 While it may seem crazy, it’s likely that OPEC members are seeking to drive smaller producers out of the market.
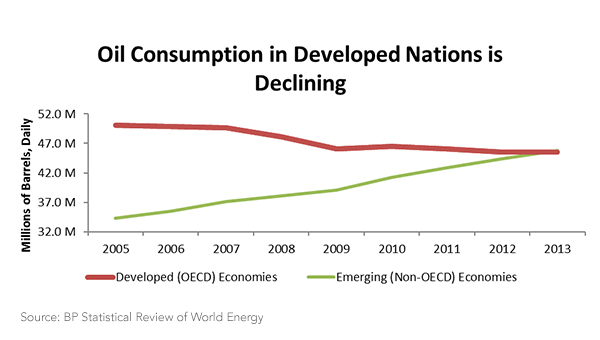
On the other side of the equation, economic growth in many major oil markets is stalling, reducing the demand for oil. Developed countries have also made major strides in reducing energy use and increasing efficiency. All this spells declining demand in many markets. Global oil consumption estimates have been cut four times this year as the oil industry struggles to come to grips with changing fundamentals.6
Other long-term factors may affect future oil demand. Economists predict that U.S. gasoline consumption will flatten and contract in coming years.7 Demographic trends in the U.S. suggest that domestic demand may fall as baby boomers retire and reduce their driving; Millennials, members of the largest generation in U.S. history, are moving to cities and using alternative transportation in increasing numbers. Use of renewable energy sources is also on the rise and expected to continue, though cheap oil may make alternative energy less fiscally appealing.
WHAT DOES CHEAP OIL MEAN FOR THE U.S.?
On the positive side, lower prices will likely boost consumer sentiment and increase discretionary spending, which is great news for U.S. businesses. Based on U.S. Highway Administration estimates, this year’s gas price drop has translated into over $1,000 in annual savings for the average American household.8
On the other hand, the U.S. is becoming a serious oil producer and low prices are bad news for domestic oil producers. The economic viability of U.S. shale oil production (the source of its recent oil boom) relies on high oil prices to offset expensive extraction. One metric used by energy analysts is the “breakeven price,” which is the oil price needed for projects (or producers) to make a healthy return. Can shale oil producers survive in a world of dirt-cheap oil? Opinions differ; the chart below shows the estimated breakeven price for several shale oil projects.
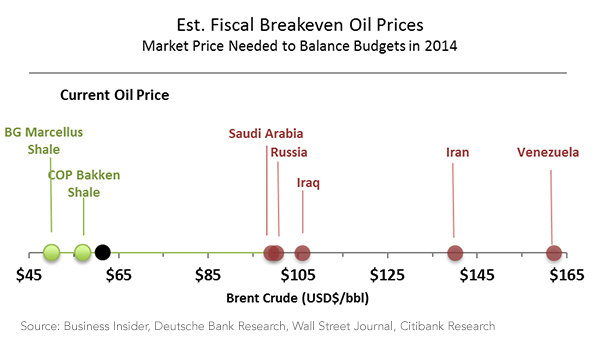
While some projects may be able to survive low oil prices, one estimate puts the average breakeven price of U.S. shale projects around $65-$70/barrel, indicating that many are vulnerable to low oil prices.9
Globally, oil price instability and continued downward pressure could mean bad news for major producers like Saudi Arabia and Russia that depend on oil revenues to make debt payments. While some countries have large cash reserves that will help cushion the effects of cheap oil, the long-term economic effects could be serious.
BOTTOM LINE: HOW LOW CAN OIL GO?
Well, that’s the trillion-dollar question and everyone has a guess. Government energy economists are currently forecasting an average price of $68/barrel on Brent Crude, though they admit there’s a great deal of uncertainty in price forecasts right now.10
Are oil and gasoline prices going to remain this low? Hard to know. The prices we are seeing are partially the result of speculation and bearish sentiment on oil. While fundamentals suggest oil prices will remain depressed in 2015, it’s unlikely that $2.00 gas is here to stay.11 Let’s make the most of it while we can.
Looking ahead, we can expect additional market volatility as traders take a look at their portfolios after last week’s rout. Wednesday’s Federal Reserve Open Market Committee meeting will also be in focus; analysts hope that the Fed will address how the recent drop in oil prices may affect the timing of future interest rate increases.
1 http://www.cnbc.com/id/102263988
2 http://bit.ly/1A1QcYy
3 http://www.cnbc.com/id/102263988
4 http://www.eia.gov/dnav/pet/pet_pri_spt_s1_d.htm
5 http://bit.ly/1uMkU1o
6 http://bloom.bg/1zeU6Ml
7 http://www.bloomberg.com/graphics/2014-america-shakes-off-oil-addiction/
8 http://www.bloomberg.com/news/2014-10-16/shale-boom-helping-american-consumers-like-never-before.html
Calculation assumes average annual consumption of 1,000 gallons of gasoline. Peak average gas price of $3.788/gal (EIA weekly average 4/28/14) and $2.600/gal (AAA daily average 12/12/14).
9 http://www.economist.com/news/finance-and-economics/21635505-will-falling-oil-prices-curb-americas-shale-boom-bind
10 http://www.eia.gov/forecasts/steo/report/prices.cfm
11 http://www.eia.gov/forecasts/steo/report/prices.cfm

INVESTING RISK DISCLOSURE
Keep in mind that investing involves risk. The value of your investment will fluctuate over time and you may gain or lose money. Before investing, consider the funds’ investment objectives, risks, charges, and expenses. Contact Mahoney Asset Management for a prospectus or, if available, a summary prospectus containing this information. Read it carefully.
IMPORTANT CONSUMER INFORMATION
This web site has been prepared solely for informational purposes. It is not an offer to buy or sell any security; nor is it a solicitation of an offer to buy or sell any security.This site and the opinions and information therein are based on sources which we believe to be dependable, but we can not guarantee the accuracy of such information.
Representatives of a broker-dealer or investment adviser may only conduct business in a state if the representatives and the broker-dealer or investment adviser they represent: (a) satisfy the qualification requirements of, and are approved to do business by, the state; or (b) are excluded or exempted from the state’s licenser requirements.
An investor may obtain information concerning a broker-dealer, an investment advisor, or a representative of a broker-dealer or an investment advisor, including their licenser status and disciplinary history, by contacting the investor’s state securities law administrator.
The financial calculator results shown represent analysis and estimates based on the assumptions you have provided, but they do not reflect all relevant elements of your personal situation. The actual effects of your financial decisions may vary significantly from these estimates–so these estimates should not be regarded as predictions, advice, or recommendations. Mahoney Asset Managment does not provide legal or tax advice. Be sure to consult with your own tax and legal advisors before taking any action that would have tax consequences.
SECURITIES: ARE NOT FDIC-INSURED/ARE NOT BANK-GUARANTEED/MAY LOSE VALUE
This information is intended for use only by residents of CA, CT, DC, FL,, MA, MD, MN, NC, NJ, NY, OH, PA, and VA. Ken Mahoney may only conduct securities business with residents of the states and/or jurisdiction for which they are properly registered.
Securities offered through Newbridge Securities Corporation, member FINRA, SIPC.
Investment Advisory services through NFSG Corporation an SEC Registered Investment Advisor.
Office of Supervisory Jurisdiction: 1200 N. Federal Hwy., Ste. 400, Boca Raton, FL 33432. Phone 954.334.3450 Fax 954.489.2390
Specific recommendations can only be based on review of a number of suitability factors including but not limited to the investors financial profile, investment objectives, risk tolerance and the investors review of appropriate offering documents. Past performance is no guarantee of future results. To help you make informed decisions, we provide you with essential disclosures, such as Regulation Best Interest (Reg BI), the Client Relationship Summary (CRS), and Form ADV. Linked sites are strictly provided as a courtesy. Newbridge Securities, Inc. does not guarantee, approve nor endorse the information or products available at the sites, nor do links indicate any association with or endorsement of the linked sites by Newbridge Securities.