
Markets ended another volatile week on an upbeat note after a wave of economic data showed that the economy is still on the right track. For the week, the S&P 500 gained 0.95%, the Dow grew 0.93%, and the Nasdaq gained 1.19%.1
One of the biggest headlines last week was the April jobs report, which showed that 288,000 new jobs were added in April, many more than economists had predicted. Even better, employment gains were widespread and represented growth in multiple sectors across the economy.2
The monthly jobs report garners a lot of attention. We wanted to use this week’s update to dig deeper into some of the data behind employment reports to show you why jobs numbers are watched so closely.
Why do labor market reports matter?
Employment reports matter to the overall economic picture because jobs growth is an important stimulus for economic growth. Job growth is highly correlated with improvements in consumer confidence, which often presage increases in spending.3 Since spending accounts for over two-thirds of economic activity, you can understand why analysts monitor the labor market closely.
Is the labor market actually improving?
If you’ve been keeping tabs on the many labor market-related headlines, you’ve probably heard pundits say that the labor market is showing signs of overall improvement. What does that mean, exactly?
Labor Market Data Snapshot
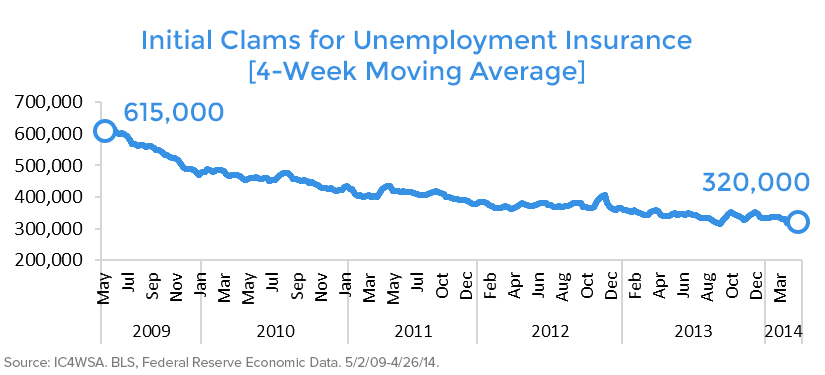
Let’s look at some data. One of the most important short-term indicators of labor market health is the weekly initial claims for unemployment, which captures new applications for unemployment benefits. You can see in the chart below that the 4-week moving average of initial claims (a much less volatile measure than weekly claims) has been steadily declining since the recession peak in 2009. While the data is volatile and ‘noisy,’ the long-term trend shows significant improvement.
Another important indicator is the number of voluntary separations, which tracks workers’ willingness and ability to leave their jobs. Generally, this happens when folks find a better job, so it’s a good signal of improvements in the quality and quantity of jobs available.
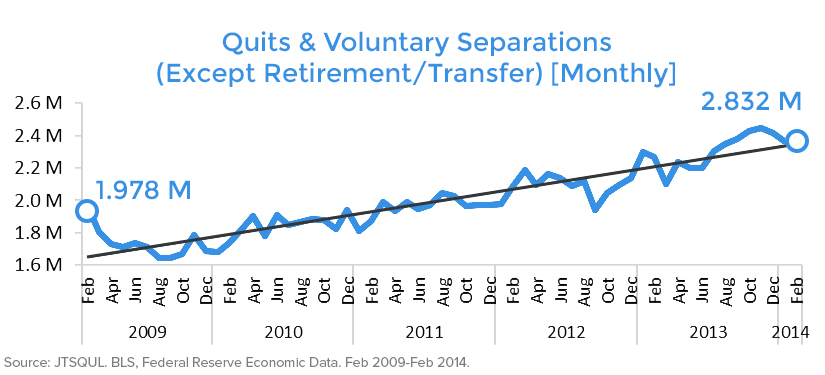
This chart shows that the number of monthly quits has been on a general upward trend since early 2009.
However, the picture isn’t completely rosy. Much of the fall in the employment numbers released last week can be attributed to the more than 800,000 Americans who dropped out of the labor force in April.4
Realistically, declining labor force participation is probably going to stay with us as baby boomers continue to retire and young people wait longer to find employment. However, most of the recent decrease comes from discouraged workers who are dropping job searches out of frustration. This fact is troubling.
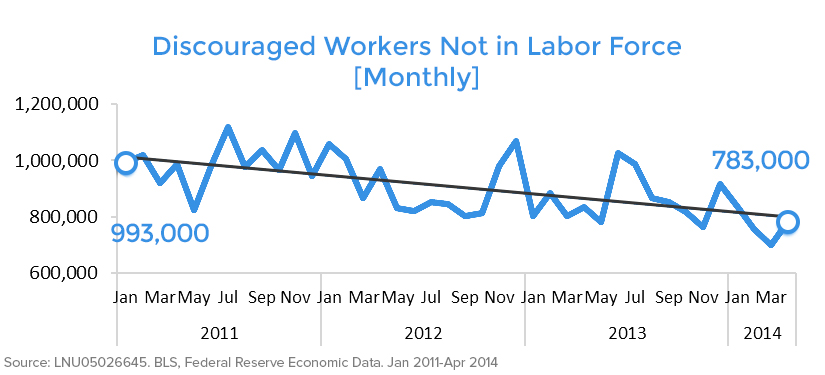
The Bureau of Labor Statistics (BLS) defines discouraged workers as those who want a job but are not currently looking because they don’t believe jobs are available or that they qualify for current opportunities.5 You can see that the measure of discouraged workers is extremely volatile, but the overall trend since 2011 is downward, which is where we want it to be.6 However, we’ve still got a long way to go before workers and their skills will match available jobs.
What Does the Unemployment Rate Actually Show?
You’ve probably heard a lot about the unemployment rate. However, did you know that the government calculates six different measures of unemployment? The so-called headline rate is officially known as the U-3 measure and calculates total unemployed as a percent of the total civilian labor force. For a broader measure, we can look at the U-6 rate, which also captures under-employment. This calculation includes people who, while they don’t meet BLS definitions of unemployed, still suffer the effects of a weak job market.
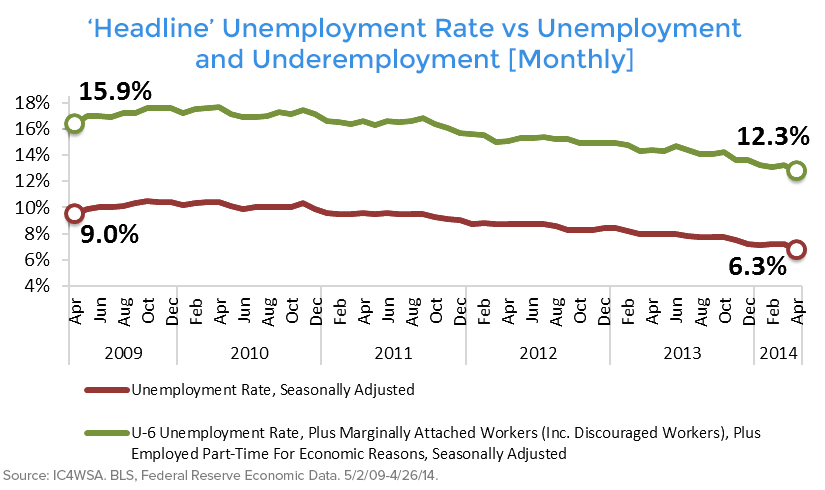
The top line shows this broader measure of unemployment. Right now, while the headline unemployment rate is 6.3%, we can tack on another 6.0%-worth of discouraged, under-employed, and forced part-time workers. Digging a bit deeper, involuntary part-time work is the largest contributor to the difference between headline unemployment and the U-6 measure, indicating that, while many Americans have jobs, they aren’t able to work as much as they might like.7
Bottom Line: The Labor Market Is Improving
Overall, medium- and long-term trends in employment data show that the labor market is largely getting better. However, in the short-term, seasonal effects, unique business events, and other factors can make the jobs picture much less clear.
This is why policy makers like the Federal Reserve look at a variety of indicators (including the data we’ve examined in this update) to develop a more nuanced view of what is happening in the economy. As financial representatives, it’s our job to monitor many different indicators, including the data we’ve shared with you in this update, to understand the current economic picture and develop strategies for our clients.
I hope you’ve enjoyed our foray into some of the numbers behind the employment headlines. We enjoy providing educational and informative content, and we welcome any comments or questions you may have.
1 http://bit.ly/RmcAtg
2 http://1.usa.gov/1gck641
3 http://bit.ly/1fNONhc
4 http://1.usa.gov/1gck641
5 http://1.usa.gov/1usrAoI
6 N.B. The time period in this chart is different because the BLS changed its calculation method for discouraged workers in January 2011, rendering comparisons before and after the change problematic.
7 http://bit.ly/1iWFCFC
8 http://onforb.es/Q0zK7e
9 http://on.barrons.com/LWYiMz
10 http://bloom.bg/1hgPDhn
11 http://fxn.ws/1kuppsH

INVESTING RISK DISCLOSURE
Keep in mind that investing involves risk. The value of your investment will fluctuate over time and you may gain or lose money. Before investing, consider the funds’ investment objectives, risks, charges, and expenses. Contact Mahoney Asset Management for a prospectus or, if available, a summary prospectus containing this information. Read it carefully.
IMPORTANT CONSUMER INFORMATION
This web site has been prepared solely for informational purposes. It is not an offer to buy or sell any security; nor is it a solicitation of an offer to buy or sell any security.This site and the opinions and information therein are based on sources which we believe to be dependable, but we can not guarantee the accuracy of such information.
Representatives of a broker-dealer or investment adviser may only conduct business in a state if the representatives and the broker-dealer or investment adviser they represent: (a) satisfy the qualification requirements of, and are approved to do business by, the state; or (b) are excluded or exempted from the state’s licenser requirements.
An investor may obtain information concerning a broker-dealer, an investment advisor, or a representative of a broker-dealer or an investment advisor, including their licenser status and disciplinary history, by contacting the investor’s state securities law administrator.
The financial calculator results shown represent analysis and estimates based on the assumptions you have provided, but they do not reflect all relevant elements of your personal situation. The actual effects of your financial decisions may vary significantly from these estimates–so these estimates should not be regarded as predictions, advice, or recommendations. Mahoney Asset Managment does not provide legal or tax advice. Be sure to consult with your own tax and legal advisors before taking any action that would have tax consequences.
SECURITIES: ARE NOT FDIC-INSURED/ARE NOT BANK-GUARANTEED/MAY LOSE VALUE
This information is intended for use only by residents of CA, CT, DC, FL,, MA, MD, MN, NC, NJ, NY, OH, PA, and VA. Ken Mahoney may only conduct securities business with residents of the states and/or jurisdiction for which they are properly registered.
Securities offered through Newbridge Securities Corporation, member FINRA, SIPC.
Investment Advisory services through NFSG Corporation an SEC Registered Investment Advisor.
Office of Supervisory Jurisdiction: 1200 N. Federal Hwy., Ste. 400, Boca Raton, FL 33432. Phone 954.334.3450 Fax 954.489.2390
Specific recommendations can only be based on review of a number of suitability factors including but not limited to the investors financial profile, investment objectives, risk tolerance and the investors review of appropriate offering documents. Past performance is no guarantee of future results. To help you make informed decisions, we provide you with essential disclosures, such as Regulation Best Interest (Reg BI), the Client Relationship Summary (CRS), and Form ADV. Linked sites are strictly provided as a courtesy. Newbridge Securities, Inc. does not guarantee, approve nor endorse the information or products available at the sites, nor do links indicate any association with or endorsement of the linked sites by Newbridge Securities.